How to Boost Your Revenue on Green Wednesday and Beyond
As the holidays approach, so does the 2nd most popular day of the year to buy cannabis products, also known as Green Wednesday. The day before Thanksgiving, or Green Wednesday, has traditionally been the second-highest dispensary sales day of the year besides 4/20.
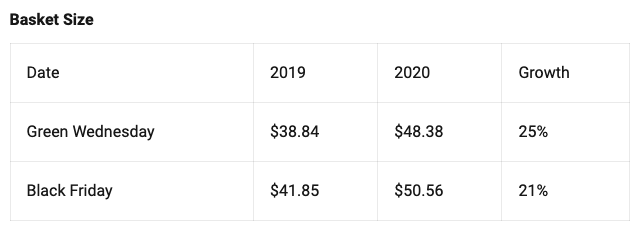
Last year, Green Market Report reported an average of 80% increase in daily dispensary sales in 2020 on Green Wednesday. The following Black Friday also saw a 75% increase in sales. This behavior could be due to preparation for less-than-sober family get-togethers, changes in the weather, or other reasons. No matter the cause, it's a clear opportunity for retail cannabis operations to seize and boost end-of-year sales.

Source: Green Market Report
This article will share features in SellTreez and AskTreez that you can use this holiday season to boost sales and streamline operations for the best possible customer experience.
Create a fast check-in experience
Did you know that SellTreez comes with a mobile app (can be used on either an iPhone or iPad) designed to speed up your customer intake process? It's called SellTreez Customer Management, available for download in the App Store. Quickly check-in returning customers by either scanning their ID directly or searching your customer database. Give your budtenders the ability to create an experience tailored to your customer's needs. Have their purchase information and documents front-and-center so that they can better upsell and recommend products. When it comes to the actual day of Green Wednesday, easily manage your queue for a smooth customer flow. Keep track of customer wait times, and simply swipe to remove customers.
Stock up for the holidays with data-driven insights
AskTreez gives your Inventory Purchasing Managers the insights and data they need to stock up your store for the holiday season effectively. AskTreez connects dispensaries and vendors to the most accurate, real-time market trends and dispensary analytics available. Specifically, the AskTreez "Market" tab allows you to search purchasing trends across your market by a wide range of categories. So let's go through the most relevant dashboards to help you make inventory purchasing decisions in a little more depth.
- The Market Basic option provides a general overview of your state-wide cannabis market in real-time. This view of AskTreez has cards like "Market Share by Gross Receipts" and "Market Share By Units Sold" so you can review consumers' purchasing habits, monitor the growth of your competition, and track market changes in near real-time.
- The Market Basket Affinity option allows you to find various brand associations within our market data. This report works by looking at combinations of brands that occur together frequently in transactions. Use this dashboard to identify consumer patterns or observe how the purchase of one brand will affect the purchase likelihood of another brand (or even the same brand).
- The Market Demographics Dashboard highlights basic and advanced demographic data to quickly compare regions and counties by product type, gender, price points, and more. With this dashboard, you can identify where your competition is most prevalent and recognize consumer profile patterns.
- The Market Penetration Dashboard highlights how well a brand or product is distributed in the market and its overall selling potential. By looking at various metrics such as All Commodity Volume (ACV), % ACV, and Velocity Gross Receipts, we can provide a snapshot of how a brand or product impacts the stores they are in and vice versa.
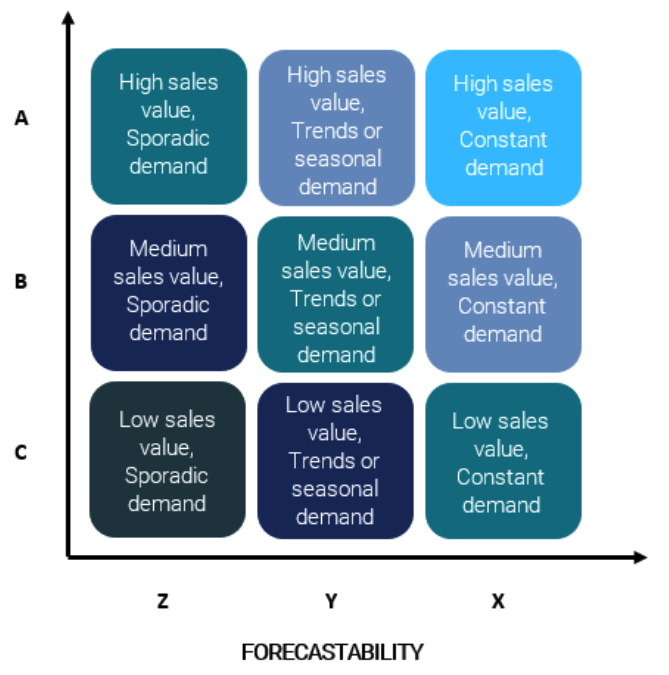
- The Market Product Performance dashboard is our take at bringing the ABC/XYZ analysis to the cannabis world. The ABC/XYZ analysis is a method of classifying products according to their revenue value and volatility of demand, meaning individual products are grouped by how much money they bring into your shop (ABC) and how steady their demand is (XYZ).
- The Market Retention dashboard gives you insight into how likely a customer will repurchase the same brand after a matter of months and how that frequency changes over time. On this dashboard, we present two grids to compare two brands and their customer retention percentages.
- The Market THC Dashboard allows you to analyze THC potency as it correlates with product attributes. We provide a high-level look at various products across multiple brands with similar THC %, post-tax price points by SKU, and unit sales history.
The "Inventory" tab in AskTreez equips you with three different dashboards about your store's inventory. It identifies current opportunities for improvement to boost revenue for Inventory Managers. The Brand Inventory Levels dashboard provides a near real-time window into your operation. It enables you to manage all the moving parts. By default, this dashboard displays data for the last 90 days. However, the date filter can analyze inventory movement over a select period. This dashboard can:
- Track inventory levels across all locations
- Identify your top-selling items and breadwinner products
- Forecast your inventory based on recent sales trends
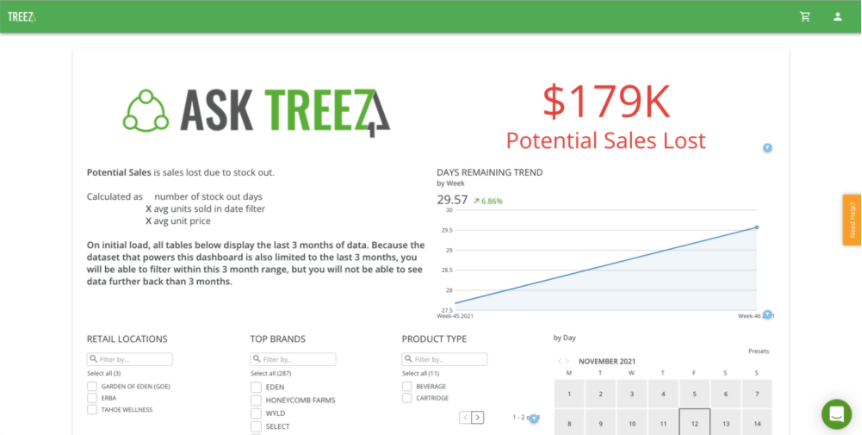
- Monitor potential sales lost or gained due to inventory management skills

Much like the Market Product Performance dashboard, Brand Product Performance under the inventory tab uses ABC/XYZ analysis to classify products in your store according to their revenue value and demand volatility. Individual products are grouped by how much money they bring into your shop (ABC) and how steady their demand is (XYZ).

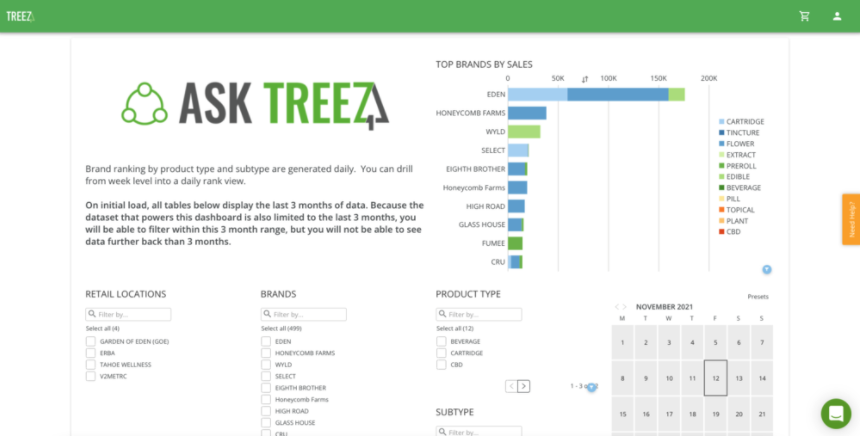
The Brand Ranking dashboard highlights a brand's ability to generate your shop revenue based on either Product Type or Subtype. Depending on its contribution to overall sales to either category, we give each brand a daily ranking and use that data to generate the brand's weekly rating.
You can use this dashboard to:
- Monitor a particular brand's health
- Identify opportunities to run campaigns for specific brands
- Compare brand sales across the same product type and/or subtype

Make shopping and paying more convenient
We all have a lot to get done during the holidays, so offering a flexible shopping experience is key to winning more business during this time. SellTreez Pay provides three different options for cashless payments that add convenience to the cannabis retail shopping experience.
- ACH Payments for e-commerce allow you to take payments digitally for online and delivery orders. This option integrates with the most popular cannabis e-commerce platforms today so that your customers can order their cannabis online and pay online.
- PIN Debit Payments allow your customer to pay for in-store, curbside, or delivery orders directly from their debit card. Bonus! This method of cashless payments also allows an added tip to the transaction for your hard-working budtenders.
- Cashless ATM transactions are similar to PIN Debit payments in that funds are pulled directly from your customer's debit card. However, be aware that this option acts just as a physical ATM and pulls funds in $10 increments, and also charges a small fee per transaction, just as an ATM does.
Get the most out of Green Wednesday
As your team prepares for Green Wednesday and the holiday shopping season in general, these tools available in SellTreez, SellTreez Pay, and AskTreez will help increase profits as well as consumer satisfaction.If you need additional help using any of the tools mentioned in this article, please reach out to support@treez.io, or utilize the in-app chat feature to talk with our team. If you'd like to learn more about SellTreez, AskTreez, and any other part of the Treez platform, book some consultation time with our team for a personalized demo.